
Human Risk Score: measured risk
Measure human risk with a Human Risk Score per person, team and company. Prioritize interventions from real behavior, not course completions.
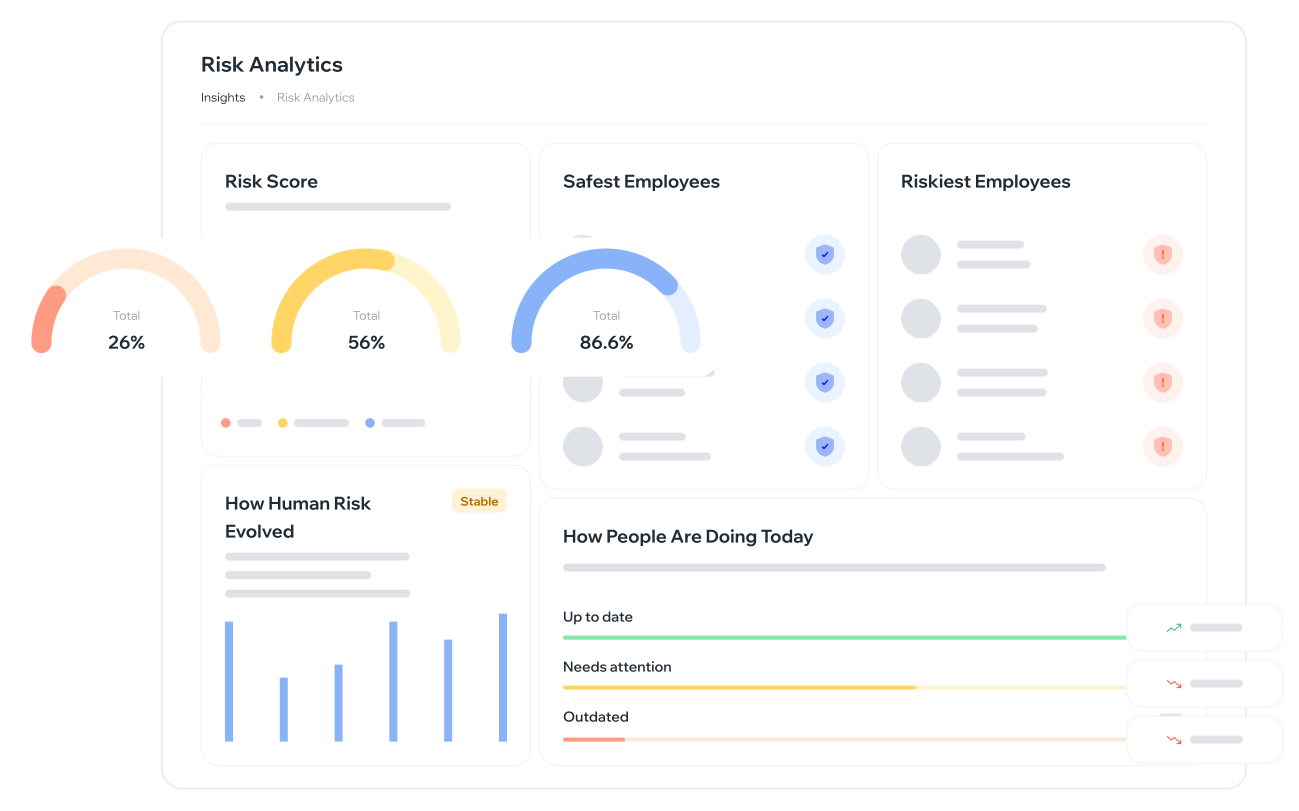
How the Human Risk Score is built
Captures behavioral signals in real time: simulations, training, and recurrence patterns.
Builds a risk score by user, team, and organization to identify the most exposed profiles.
Generates concrete recommendations on what to simulate, what to reinforce, and how to communicate progress to leadership.
Visibility that enables decisions
risk score
Exposure level by person, team and organization.
teams
Automatic segmentation by behavior, exposure, and evolution.
benchmarks
Compare key signals with useful references to understand maturity and gaps.
Security, compliance, and leadership aligned with clear, recurring information.
alerts
Detect relevant changes before they become critical exposure.
PDF, Excel, and API. Bring analytics to the formats your team, board, or technology ecosystem needs.
risk score
Exposure level by person, team and organization.
teams
Automatic segmentation by behavior, exposure, and evolution.
benchmarks
Compare key signals with useful references to understand maturity and gaps.
Security, compliance, and leadership aligned with clear, recurring information.
alerts
Detect relevant changes before they become critical exposure.
PDF, Excel, and API. Bring analytics to the formats your team, board, or technology ecosystem needs.
risk score
Exposure level by person, team and organization.
teams
Automatic segmentation by behavior, exposure, and evolution.
benchmarks
Compare key signals with useful references to understand maturity and gaps.
Security, compliance, and leadership aligned with clear, recurring information.
alerts
Detect relevant changes before they become critical exposure.
PDF, Excel, and API. Bring analytics to the formats your team, board, or technology ecosystem needs.
Closing the incident loop
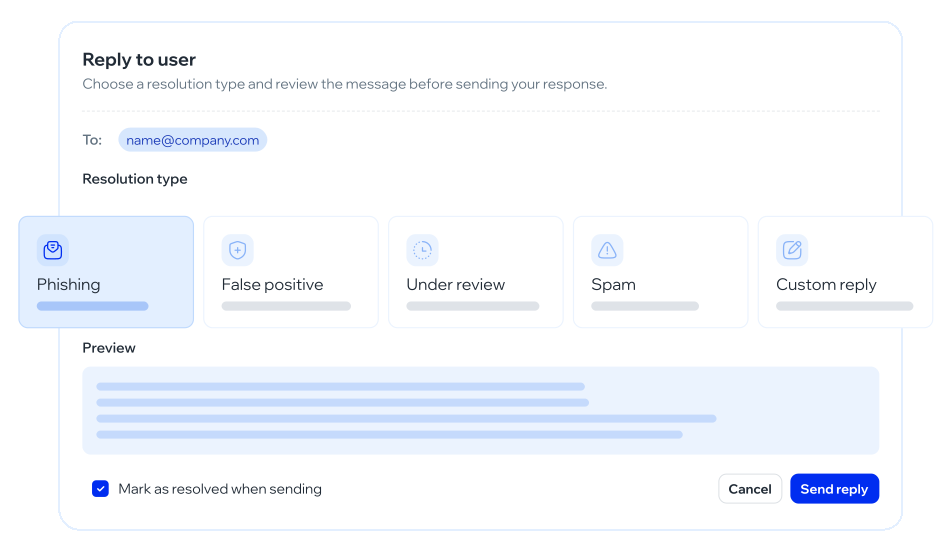
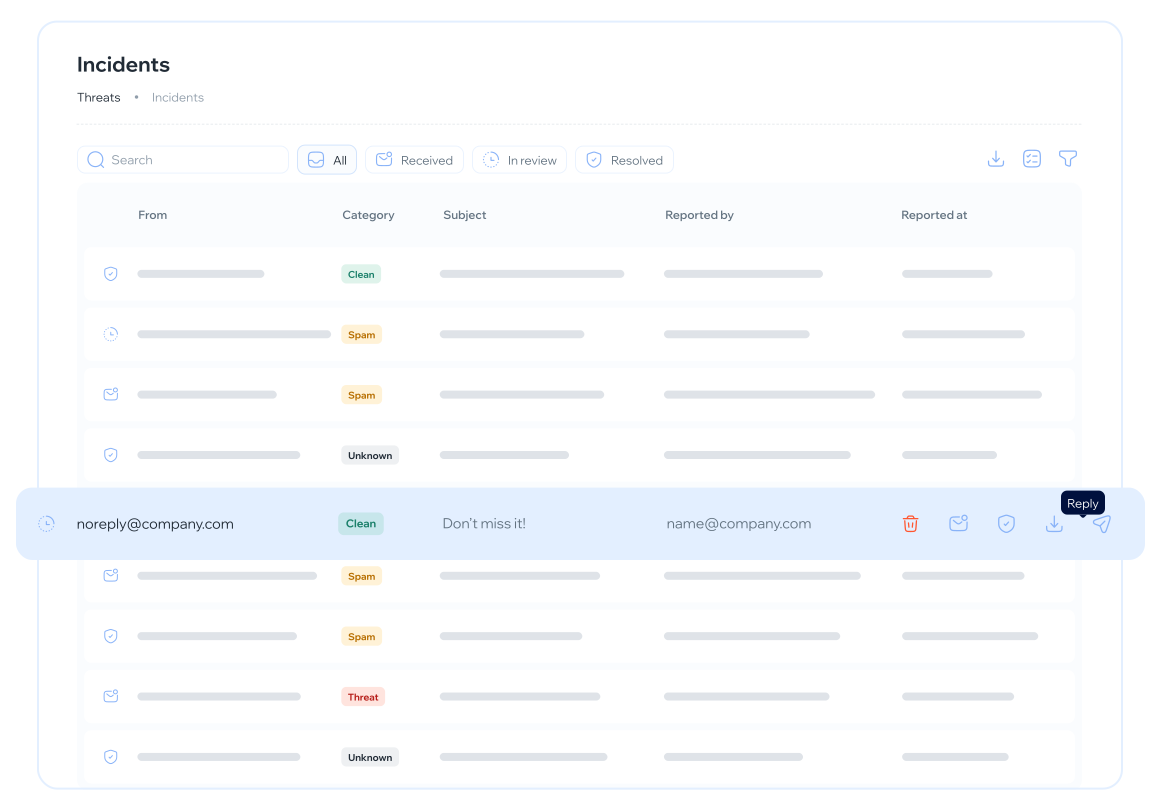
When an employee reports a suspicious email, Whalemate determines whether it's a real threat or a simulation, prioritizes the response, and turns it into a signal for the user's risk profile — without manual intervention.
Clear data for executive decision-makers
Whalemate generates automatic executive visibility: program evolution, highest-exposure areas, and intervention impact — in the language CISO, IT, compliance, and leadership need to make decisions and demonstrate progress.
Program capabilities
Benchmark
Compare your program signals with an industry reference when one is published. Not a country ranking, and not the score formula in the open.
Analysis by employee, group and company
The same index, cut by person, by team, and by company. One view to prioritize interventions — not three reports built by hand.
Campaign impact, explorer and detail
What changed after the send, who fell, and what was reinforced. Campaign data lives next to the index, not in a separate spreadsheet.
Human Risk Score: an index to prioritize — not to punish
The risk score, smart groups, and executive reports exist so security knows where to intervene. They are not an HR file.
To identify who concentrates the risk, you have to measure it. The platform builds a continuous score by person, team, and organization from behavioral signals: simulations, training, repeat patterns. Not from a survey or from course attendance. The CISO stops asking “how are we doing?” on instinct. Leadership stops receiving a completion-rate slide. The number is not a ranking for HR. And the contract says it explicitly: no individual metric is used for disciplinary purposes.
Smart groups cluster by behavior, not only by the org chart. The team that receives the most lures is not always the one that accumulates the most risk. Segmentation lets you intervene without building lists by hand. Anomaly alerts exist so a pattern change is not seen three months later in a QBR. None of that replaces the analyst’s judgment. It replaces the spreadsheet the analyst built on Friday.
Executive reports translate evolution, areas of highest exposure, and the effect of interventions. The language is the one CISO, IT, compliance, and leadership need. They can be exported. The score can leave by API to the dashboard they already use. What does not leave is a “hall of shame.” If a weekly report is used to single people out, the program is badly governed. The module is designed to prioritize interventions, not to feed a regime.
Score, groups, and reports — three readings of the same data
Analytics is not a decorative dashboard. It is the criterion for who gets what next.
Human risk score
An actionable metric by person, team, and organization. It is built from continuous signals, not an annual snapshot. It is used to prioritize. In the demo you see how it is read, what goes in, and…
Smart groups
Automatic segmentation by behavior, exposure, and evolution. It complements the org chart: sometimes the risk sits in a cross-cutting role, not in a department. Security stops building lists. People…
Reports for leadership
Program evolution, areas of highest exposure, effect of interventions. Weekly cadence when configured. Export to the formats the board or the auditor asks for. The executive report does not list the…
Questions about human risk analytics
Stop reporting activity. Start managing risk.
Book a demo and discover how Whalemate turns human behavior into actionable security decisions.